This material originally appeared as a chapter in W. Bello and J. Chavez (eds.) State of Fragmentation: The Philippines in Transition. Bangkok: Focus on the Global South.
This entry is the third of a four-part serialization.
Part I
Part II: The new rules of the game
Part IV: The city and the restoration of class power
All these transformations—the Philippine brand of neoliberalization, the unique vectors through which its economy globalized, and its uneven sectoral and geographical development—converge in urban real estate. Mirroring the trajectory of the economy as a whole, real estate development began the decade in crisis: the sector shrank from 2000 to 2002, hitting a 24.7 percent year-on-year contraction in the first quarter of 2001. But beginning with 2003, residential lot sales, coupled with office and retail space rental and leasing, have sustained record levels of growth: from the second quarter of 2004 until the fourth quarter of 2008, it sustained a double-digit streak, broken only twice by dips into high single-digit growth rates (see Figure 3). In the third quarter of 2006, the sector grew at a record pace of 26.2 percent year-on-year, breaking a record that was previously set in the third quarter of 1982. This record was broken yet again when the sector grew by 27.7 percent in the second quarter of 2010. At the end of its bust period in 2002, the gross value added of real estate development stood at approximately PhP8.8 billion. In 2010, it had grown to PhP22.1 billion.[1] If considered as a separate subsector, real estate was the second-fastest growing sector of the economy over the past decade, outpaced only by mining.
Figure 3. Real estate gross value added growth rate versus GDP growth rate, 2003-2010.[2]
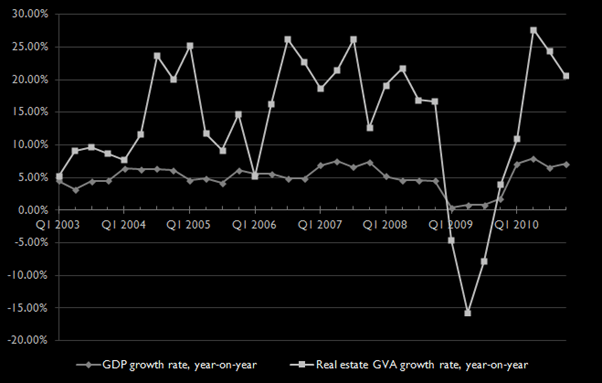
At the heart of this spectacular growth were remittances from overseas Filipinos, which are fueling home construction and condominium sales; office space leasing by the BPO industry; and retail space rentals in malls, driven by consumer demand from the new globalized middle classes. In a press release for the record-breaking third quarter of 2006, the National Statistical Coordination Board noted: “brisk sales from residential projects by OFWs, the strong demand for business office spaces from the BPO industry and higher income from rental and leasing operations from newly opened supermalls propelled the growth of real estate.”[3]
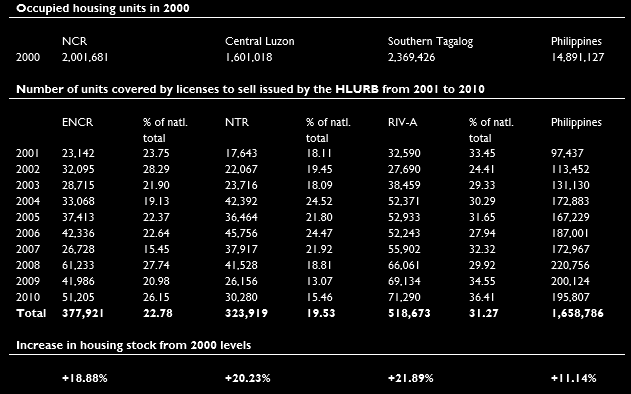
By the industry’s own reckoning, 30 percent of all remittances sent by overseas Filipinos are being spent on real property.[4] Going by this estimate, some US$5.6 billion of OFW remittances was spent in the sector in 2010 alone (see Figure 4). At the level of individual firms, Vista Land estimates that fully 60 percent of their sales are from overseas Filipinos;[5] Robinson’s Land, 40 percent;[6] and for Ayala Land, 20 percent.[7] Much of this investment is being poured into Manila and its suburbanizing periphery. In 2000, there were a little over 2 million occupied housing units in the NCR; in the ten years since, permits for the construction of 377,471 new units were issued for the region (see Table 3). From 2002 to 2010, some 21 million square meters’ worth of new residential space—an area equivalent to the land area of Marikina—was constructed in the NCR, accounting for 27 percent of total residential construction in the country. If residential construction in the adjoining provinces of Bulacan, Cavite, Laguna and Rizal are included, the total runs up to 37.7 million square meters and 48 percent of new residential construction nationwide.
Figure 4. Overseas Filipinos’ remittances and estimated real estate investments, 2000-2012[8]

Table 3. Occupied housing units in 2000 cf. number of units issued licenses to sell by the Housing and Land Use Regulatory Board, 2001 to 2010[9]
Commercial construction is undergoing a similar boom: at the beginning of the decade, office space supply in the NCR stood at around 3.6 million square meters. By its end, supply had increased by more than 50 percent to a little less than 5.5 million square meters.[10] Demand from the BPO industry, to the tune of 300,000 square meters per year, had resuscitated office rentals from a near-crash in the wake of the Asian financial crisis.[11] Office vacancy rates, which peaked at around 18 percent in 2001, have been on a steady downtrend since; by early 2012 vacancy rates across the NCR had been reduced to below 2 percent, and demand for office space is expected to outstrip supply by 2015.[12] Non-residential construction from 2002 to 2010 reached 20.2 million square meters in the NCR and 27.6 million square meters in its extended metropolitan region, accounting for 37 and 50 percent of total construction in the country, respectively (See Table 4).
Table 4. Permits for construction issued for Metro Manila and its four surrounding provinces, 2002 to 2010[13]

Manila’s globally-renowned retail landscape also took on its definitive shape over the past decade. When it began, there were approximately 3 million square meters of retail space in its malls. By the end of the decade, this figure had grown by 60 percent to 5 million square meters.[14] SM Prime accounted for more than half of this space, at 2.7 million square meters, followed by Ayala Land, at approximately 808,000 square meters, and Robinson’s Land, with 723,000 square meters. Together, these three operators accounted for almost 85 percent of the total mall retail area in Metro Manila, and almost all of the new leasable areas constructed over the decade. In 2000, these three companies raked in a total of PhP8.1 billion in retail space rental income; by 2010, this had grown to PhP30.3 billion (see Table 5).
Table 5. Leasable retail floor area and revenues for retail rental for the three major mall operators, 2000 and 2010.[15]

Even as it was integrating urban real estate into circuits of global capital, neoliberalization was also freeing up supplies of urban land. Much of this supply was in the form of privatized state land, particularly converted military bases, but also former national government centers, such as the North and East triangles in Quezon City, and the sale of reclaimed land, as in Pasay. Particularly interesting in the latter two examples is the way grand visions of state-led urban development and planning had given way to the logic of the market: North Triangle, which was planned to house government offices, is being touted as a new central business district for Quezon City; Imelda’s ‘city from the sea’ of embassies, cultural spaces, and international expositions now hosts SM’s Mall of Asia and several big-ticket gambling and leisure developments.[16]
But the free market was not only liberating the city from the Marcoses’ New Society. It was freeing it from the fetters of the old economy as well. Land for greenfield office, residential, and industrial developments in Manila’s periphery had, in the first place, been agricultural land deliberately idled by their owners and then reclassified for other uses to avoid agrarian reform. In Cavite alone, some 4,337.5 hectares were freed up for redevelopment in this manner from 1988 to 2001.[17] Interestingly, not all of this supply, particularly in industrial parks, is being met with demand: as of 2009, a total of 1,095.5 hectares in 12 economic zones in Cavite held the dubious status of ‘developments in progress’ which were ‘not fully occupied by locators’. Some of these zones had been incorporated as economic zones as long ago as 1996.[18]
In core areas of the metropolis, idled factories of the old import-substitution industries are being demolished to create brownfield sites for redevelopment. The redevelopment of industrial land in Libis into Eastwood City, which was the first information technology special economic zone in the country, is perhaps emblematic of the broader transformation of the economy.[19] The model has since been applied to the redevelopment of the former Nestle factory in Muntinlupa, Plastic City in Valenzuela, and a belt of warehouses, silos, and factories on the north bank of the Pasig River from EDSA all the way to C-5.
Part I
Part II: The new rules of the game
Part IV: The city and the restoration of class power
[1] These estimates are in constant 1985 pesos, and were derived from data on the “Ownership of Dwellings and Real Estate” (ODRE) industry group in the quarterly National Accounts of the Philippines reports published by the National Statistical Coordination Board. Ownership of dwellings refers to the imputed rents of owner-occupied dwelling units, while real estate refers to commissions from real estate sales and mortgages, and receipts from renting and leasing of residential and commercial space. The estimate for 2002 is 17 percent of the published value for gross value added by ODRE, which is the approximate share of real estate in the ODRE industry group in 2003, while the estimate for 2010 is 31 percent of the published value for ODRE GVA, which is the share of real estate in the ODRE industry group for the 4th quarter of 2010. Sourced from National Statistical Coordinating Board (2003). “Third Quarter 2003 Gross National Product & Gross Domestic Product by Industrial Origin”, and _____ (2010). “Fourth Quarter 2010 Gross National Product & Gross Domestic Product by Industrial Origin.” National Accounts of the Philippines, Retrieved 4 May 2013 from http://www.nscb.gov.ph/sna/2003/3qtr-2003/2003ser3.asp and http://www.nscb.gov.ph/sna/2010/4th2010/2010ser4.asp.
[2] National Statistical Coordinating Board (2003-2010). National Accounts of the Philippines. Retrieved 23 February 2013 from http://www.nscb.gov.ph/sna/default.asp.
[3] National Statistical Coordinating Board (2006). “3rd Quarter 2006: Gross National Product & Gross Domestic Product by Industrial Origin.” National Accounts of the Philippines. Retrieved 4 May 2013 from http://www.nscb.gov.ph/sna/2006/3rdQ2006/2006ser3.asp
[4] Lucas, D. (2007). “OFW remittances fueling growth in real estate.” Philippine Daily Inquirer, 20 May 2007. Retrieved 4 May 2013 from http://globalnation.inquirer.net/news/breakingnews/view/20070520-67002/OFW_remittances_fueling_growth_in_real_estate.; Balea, J. (2009). “RP property sector on way to recovery.” ABS-CBN News, 29 September 2009. Retrieved 4 May 2013 from http://www.abs-cbnnews.com/business/09/27/09/rp-property-sector-way-recovery
[5] Balea, J. (2009). “RP property sector on way to recovery.” ABS-CBN News, 29 September 2009. Retrieved 4 May 2013 from http://www.abs-cbnnews.com/business/09/27/09/rp-property-sector-way-recovery
[6] No author (2008). “OFWs boost Robinsons Land housing sales.” Philippne Daily Inquirer, 11 April 2008. Retrieved 4 May 2013 from http://business.inquirer.net/money/topstories/view/20080411-129653/OFWs-boost-Robinsons-Land-housing-sales
[7] Montealegre, K.A.M. (2011) “ALI says project launches on track with goal.” Manila Times, 1 November 2011.
[8] Data on remittances from Bangko Sentral ng Pilipinas (n.d.) Economic and Financial Statistics. Retrieved 29 February 2013 from http://www.bsp.gov.ph/statistics/efs_ext3.asp.
[9] ENCR refers to “Extended National Capital Region,” and corresponds to NCR and Rizal Province. NTR refers to “Northern Tagalog Region,” and corresponds to Region III. RIVA refers to “Region IV-A,” and corresponds to Region IV-A without Rizal Province. Data sourced from Housing and Land Use Regulatory Board (n.d.) License to Sell Statistics. Retrieved 13 May 2013 from http://hlurb.gov.ph/license-to-sell-statistics/.
[10] Colliers International (2011). Philippine Real Estate Market Report: Q1 2011 Quarterly Update, p.4.
[11] Cahiles-Magkilat, B. (2012). “Local office space shortage forecast.” Manila Bulletin, 29 May 2012. Retrieved 14 February 2013 from http://www.mb.com.ph/node/360753/local-office-
[12] Colliers International (2011). Philippine Real Estate Market Report: Q1 2011 Quarterly Update, p.4; Quintos, L. (2012). “BPO boosts office space pre-leasing.” Manila Times, 21 June 2012. Retrieved 14 February 2013 from http://www.manilatimes.net/index.php/business/top-business-news/25247-bpo-boosts-office-space-pre-leasing
[13] Data derived from National Statistics Office (2012). Index of Construction Statistics. Retrieved 13 May 2013 from http://www.census.gov.ph/old/data/sectordata/databldgperm.html.
[14] Colliers International (2010). The Knowledge Report: Property Market Overview 2nd Quarter 2010, p. 10.
[15] For Ayala Land: Gross floor area figures are estimates derived from Ayala Land, Inc. (2005). 2004 Annual Report, p. 16, and ____ (2011). Ayala Land, Inc. 2010 Integrated Annual and Sustainability Report, p. 3. Ayala Land reports gross leasable areas for all its commercial centers, and the estimate for NCR was derived by subtracting gross floor areas of Ayala Center Cebu (119,565 sq.m. for 2000, 128,686 sq.m. for 2010) and Marquee Mall in Pampanga (70,000 sq.m. for 2010) from this reported figure. Revenue figures were reported in 2004, Ayala Land, Inc. (2005). 2004 Annual Report, p. 16 and 2010, and ____ (2011). Ayala Land, Inc. 2010 Integrated Annual and Sustainability Report, p. 34.
For Robinsons Land: Data on gross floor area were derived from Robinsons Land Corporation and Subsidiaries (2006). SEC Form 17-A Annual Report Pursuant to Section 17 of the Securities Regulation code and Section 141 of the Corporation code of the Philippines for the Fiscal Year Ended September 30, 2005, p. 2, and Robinsons Land Corporation and Subsidiaries (2011). SEC Form 17-A Annual Report Pursuant to Section 17 of the Securities Regulation code and Section 141 of the Corporation code of the Philippines for the Fiscal Year Ended September 30, 2010, p. 3.. Data on revenues sourced from JG Summit Holdings, Inc. (2002). JG Summit Holdings, Inc. 2001 Annual Report, p.67; Robinsons Land Corporation (2011). Robinsons Land Corporation 2010 Annual Report, p. 34.
For SM Prime: Data derived from SM Prime Holdings, Inc. (2003). Continuing the Uptrend: SM Prime Holdings, Inc. 2002 Annual Report, pp. 14-16, 25; ____ (2011). SM Prime Holdings, Inc. Annual Report 2010, pp. 16, 48.
[16] For a more substantial discussion of this theme, see Shatkin, G. (2005). “Colonial Capital, Modernist Capital, Global Capital: The Changing Political Symbolism of Urban Space in Metro Manila, the Philippines.” Pacific Affairs, 78(4):577-600.
[17] Kelly, P. (2003). “Urbanization and the Politics of Land in the Manila Region.” The Annals of the American Academy of Political and Social Science, p. 175.
[18] Provincial Government of Cavite (2009). Socio-Economic and Physical Profile 2009, p. 106.
[19] Quezon City Government (2002). Quezon City Comprehensive Land Use Plan, vol 2., p. 2.
