Skip to content

Kenneth Cardenas

  • About

Category: Data visualization

Critical cashflow analysis: Ayala Corporation, 2015

May 28, 2019May 28, 2019 ~ Kenneth Cardenas ~ Leave a comment

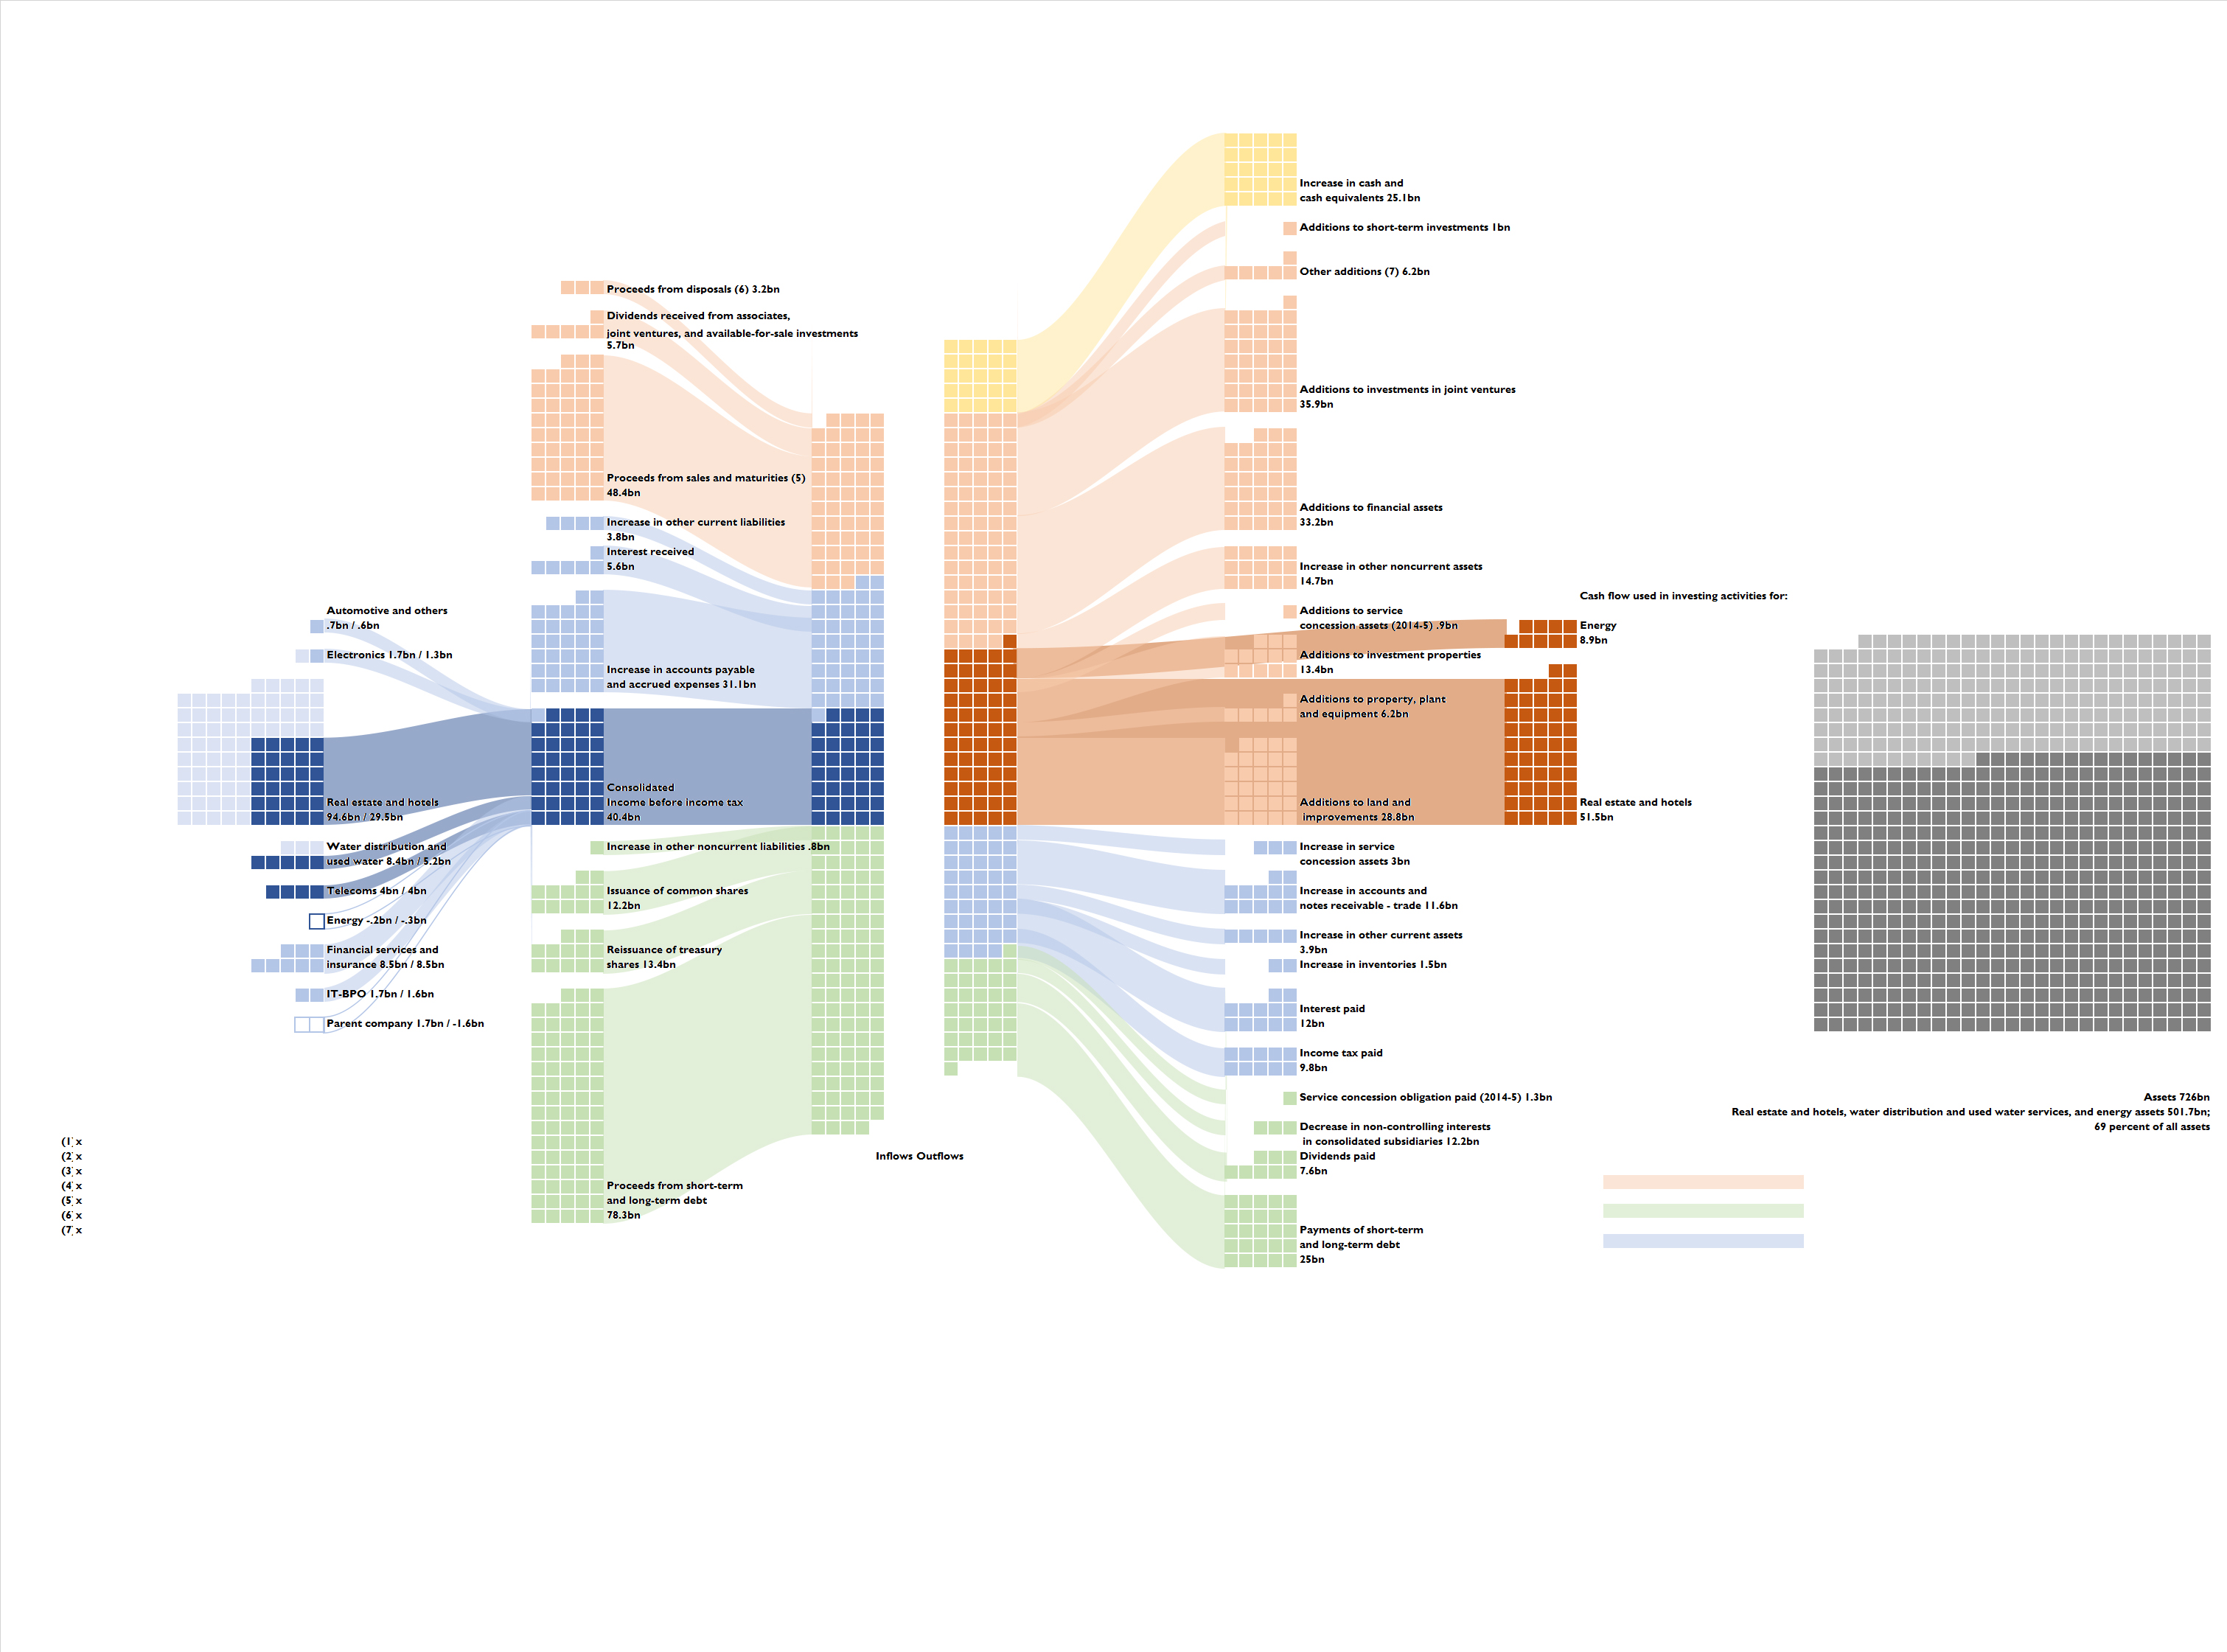
This Sankey diagram depicts data from Ayala Corporation’s 2015 Annual Report: cash flows, both into and out of the company, from and to investing, operating, and financial activities, and total assets. Urban land and infrastructure activities emphasized.

Global urbanization, 1950-2050

September 26, 2017September 26, 2017 ~ Kenneth Cardenas ~ Leave a comment

A version of this graphic saw use in Cardenas, K. and Kelly, P.F. “Shifting Urban Contours: Understanding a World of Growing and Shrinking Cities.” in A. Bain and L. Peake (eds.) (2017). Urbanization in a Global Context: Canadian Perspectives. Oxford: Oxford University Press.

dashboard

The growth of Southern megacities

March 19, 2014March 10, 2017 ~ Kenneth Cardenas ~ Leave a comment

top 30 metropolitan areas for wp

The changing composition of the thirty largest urban agglomerations of the world from 1950 to 2025.

Categories

  • Book chapters (6)
  • Comment (4)
  • Data visualization (3)
  • Due public diligence (3)
  • Methods (1)
  • Peer-reviewed (1)
  • Reading lists (1)
  • The big business of big cities (8)
  • The politics of the climate and urban crises (2)
  • Work in progress (1)

Tags

critical auditing critical discourse analysis demographic data economic geography economic history EDSA republic global urbanization housing knowledge production land Manila money and politics neoliberalization Ondoy Philippine capital Philippines political storytelling privatized urbanization remittances SEC data Southern capitalist classes Southern megacities uneven development urban cash crops urban revanchism
Blog at WordPress.com.
Cancel

 
Loading Comments...
Comment
    ×