“De-Marcosification” and the rise of new urban rentiers:

On the unintended consequences of post-EDSA privatizations.

I will be presenting this paper at the The 5th Philippine Studies Conference in Japan organized by the Annual Philippine Studies Forum in Japan, on 27 November 2022.

This paper revisits the lasting imprint left by privatizations after the EDSA Revolution on the development of capitalism in the Philippines in the early 21st century, with an emphasis on path-dependence, unintended consequences, and domestic technocratic and bureaucratic actors.

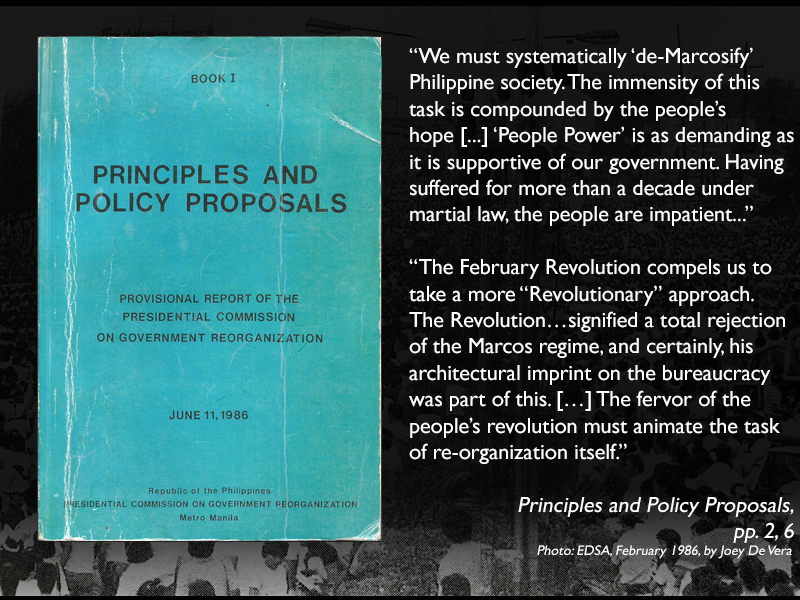
Focusing on the efforts of the Presidential Commission on Government Reorganization (PCGR) in the late 1980s, it re-evaluates how a specific understanding of the state’s role in the economy was developed through the reorganization of crony- and state-owned enterprises. It proposes that consequential features of privatization were not the outcome of an ideologically-coherent liberalization. Instead, they were part of a moralized “De-Marcosification” process: liquidating crony-owned or inefficient state investments to fund agrarian reform. This practice of linking proceeds from privatizations to specific policy objectives, in the form of “special accounts”, had since proliferated across the Philippine government. Key development and policy objectives were linked to the speed and constancy of asset liquidation, and became decisive in how privatizations in the 1990s and 2000s were implemented.

“We must systematically ‘de-Marcosify’ society.” From Principles and Policy Proposals, the provisional report of the Presidential Commission on Government Reorganization.
Continue reading ““De-Marcosification” and the rise of new urban rentiers:”

Measuring the Manila square meter

This essay originally appeared in the catalogue for the exhibition titledLiving Spaces: Hyperreal Estate and the Architecture of Dispossession“, curated by Alice Sarmiento. I wrote it in conversation with, and with thanks to, Alice Sarmiento, Andre Ortega, and Maria Khristine Alvarez.

Consider the average Manila billboard.

It is many times larger than the average Manila home. Perched above Manila’s hypertensive roads, it gets better breeze, sunlight, and sight lines than the average Manila home; its floodlights consume more power than several average Manila homes.

The visuals of the average Manila billboard are also larger than the average Manila life—especially when they peddle condominiums, those new average Manila homes for the 21st century. They feature models with impossibly white, impossibly smooth skins, living impossibly carefree lives of minutes-away convenience from the best that the city can offer, all under impossibly blue skies.

From a messaging point of view, the average Manila billboard needs to be larger than life. It must, after all, be heard above the jostle of shoulders, the knots in our backs, and the blare of last night’s death toll—all before we heave and lurch our way onto the next billboard.

It then needs to tell, within the limits set by 216 square meters,[1] convincing lies: small lies, about the life of grandeur possible within an eighteen square-meter unit,[2] about how the baked air takes your breath away, or about the mysterious dues and fees that await.

Fig. 1. About twelve 18m2 Manila studio units can fit within a 216m2 Manila billboard.

Continue reading “Measuring the Manila square meter”

The SEC’s i-Report database

This guide to the Philippine Securities and Exchange Commission’s i-Report database originally ran as a sidebar to my collaboration with Karol Ilagan and Malou Mangahas of the Philippine Center for Investigative Journalism.

AS PART of its mandate to supervise and monitor corporate activity in the Philippines, the Securities and Exchange Commission (SEC) maintains the i-Report database, which contains electronic copies of publicly available corporate filings with the agency. The most readily accessible registry of business entities in the Philippines, the database is indispensable for the everyday work of regulators, lenders, and investors—and was a crucial source of data for this story.

But outside a limited circle of researchers, the database has remained largely underused. This may partly have to do with its relative obscurity, or with the content and format of the documents that may seem inscrutable to lay eyes.

Continue reading “The SEC’s i-Report database”

Critical cashflow analysis: Ayala Corporation, 2015

This Sankey diagram depicts data from Ayala Corporation’s 2015 Annual Report: cash flows, both into and out of the company, from and to investing, operating, and financial activities, and total assets. Urban land and infrastructure activities emphasized.